Electricity consumption as a key indicator of economic activity
Economic decline is evident everywhere – in the rise of unemployment, the shuttering of firms and businesses, and the quietude in the streets. Apocalyptic forecasts of economic collapse are emerging. Goldman Sachs is predicting that “advanced economies will shrink by 35 per cent in the 2nd quarter — quadruple its financial-crisis record.” The Bank of Canada is warning that the downturn tied to COVID-19 “will be the worst on record” and that “the economic recovery will depend on the effectiveness of current measures to bring the pandemic under control.” We are no doubt navigating through uncharted waters.
To track the decline and future recovery, there is hardly a better tool than electricity consumption. Electricity is the lifeblood of modern economies and its consumption is perhaps the best real-time indicator of economic activity. To balance demand with supply, utilities track consumption on a minute-by-minute basis. These data provide an invaluable tool for assessing how the economy is trending, the rapidity of the decline, and, in the coming months, the regional and sectoral patterns of recovery.
We suggest four questions that can be addressed with careful empirical analysis.
How does current electricity consumption compare to normal expected levels?
Electricity consumption varies over the seasons. During summers, there is increased electricity demand due to air conditioning. In winters, shorter days contribute to increased lighting demand and there may also be a modest increase in heating demand, though natural gas is the primary heating fuel.
In Ontario, electricity demand on the system has been declining over the years for three reasons. First, electricity is increasingly being generated locally (so-called ‘distributed generation’), for example from wind and solar sources. Local supply reduces the demand seen by the system. However, measures of distributed generation can be incorporated in the models. Second, conservation and energy efficiency efforts have reduced demand. Third, increasing electricity prices have also had the effect of reducing electricity consumption. Thus, year-to-year comparisons require adjustment for these factors in order to predict electricity consumption.
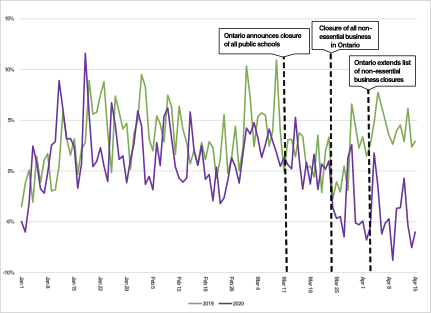
The chart below depicts the percentage change in daily electricity demand relative to seasonally adjusted electricity demand January 1 to April in 2019 and 2020. What is especially striking is the pronounced divergence that begins on March 23 with the first round of provincial closure of inessential activities, and then the further widening after April 4, the second stricter round of restrictions. By comparison, during the 2008-2009 financial crash, the decline in electricity demand was about 10 per cent. We have reached this point already, and there may be more to come.
Figure 1: Ontario electricity demand, Jan - Apr 2020 vs. 2019
(Weather normalized)
What is the relationship between electricity usage and unemployment?
Provincial unemployment data are available from Statistics Canada on a monthly basis. A historic review of unemployment and electricity volumes can provide insights.
Between February and March 2020, Ontario unemployment increased to eight per cent from 5.5 per cent. During this time period, electricity demand had fallen by about six per cent, suggesting a one-per-cent increase in unemployment correlates with a 2.4-per-cent decline in electricity demand. For purposes of comparison, in 2008-2009, unemployment increased to more than 10 per cent from six per cent at the same time that electricity demand dropped by about 10 per cent; that is, a 2.5-per-cent decline in electricity demand for each one-per-cent increase in unemployment. Furthermore, the correlation between unemployment and normalized electricity demand was strongly negative.
During the 2008-2009 period, industrial electricity demand fell by two to three times as much as the combined commercial and residential demand on a percentage basis. Industrial demand represents about 25 per cent of total system demand, but it is generally a strong indicator of economic activity. Commercial demand represents about 35 per cent of total system demand. During the current crisis, commercial business has been hit especially hard by the lockdowns, which points to the importance of isolating industrial and commercial demand for electricity in order to have better indicators of economic activity.
Can electricity usage predict GDP impacts?
GDP data is provided on a delayed basis, and monthly provincial statistics are not available from Statistics Canada. Two lines of empirical analysis would appear to be fruitful. First, Okun’s Law provides a link between changes in unemployment and changes in GDP. Okun’s original paper suggested that a one-per-cent change in unemployment corresponds to a three-per-cent change in GDP. (More recent analyses of Canadian data suggest that the latter number may be closer to two per cent). Though the Okun approach does not replace detailed modeling, it does provide a departure point.
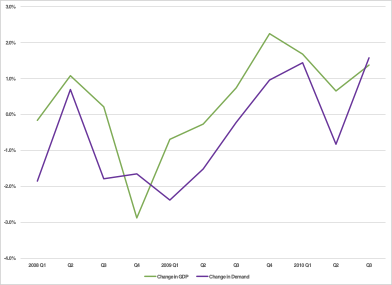
Second, Ontario provincial data is available on a quarterly basis, permitting a retrospective analysis of the ‘GDP-electricity demand’ relationship. The figure below illustrates the close relationship between changes in GDP and (normalized) electricity demand during the 2008-2010 period.
Figure 2: Quarterly changes in Ontario GDP and
electricity demand, 2008-2010
What shape will the recovery take? U, V, W or L?
In Ontario, the Independent Electricity System Operator (IESO) publishes vast quantities of data and releases most of the data daily or within a day of occurrence. This includes data on system demand. However, more data is available that could be published, and some data could be released more frequently and closer to real-time. For example, the IESO publishes detailed industrial demand, but only a month after occurrence. The IESO does not publish commercial demand. The recent decline in total demand obscures the much more precipitous drop that has occurred in commercial and industrial demand because residential demand has likely increased as people spend more time at home. Data possessed by the Ontario electricity wires companies, such as Hydro One, Alectra and Toronto Hydro, to name the three largest, would also be valuable in tracking electricity consumption and therefore economic activity.
The benefits of improved availability of real-time electricity data
If real-time sectoral and geographic electricity consumption data were made publicly available, it would provide valuable insights for policy-makers. Such data would reveal the economic status of regions within Ontario and the extent of decline and recovery of commercial and industrial segments. Real-time tracking would also illuminate the shape of the recovery: Will it be shaped like a U, V, W or L, as recently discussed in The Globe and Mail? It is possible that some parts of the economy, such as certain industrial segments, will recover more quickly than others, for example within the service sector.
At a time when the public purse will be stretched to the limits, real-time electricity data would provide policy-makers with surgical tools for targeting those industries that are particularly in need of support, and those regions that are especially hard-hit.
Brian Rivard is Adjunct Professor and Research Director, Ivey Energy Policy and Management Centre at Western University. Adonis Yatchew is Professor of Economics at the University of Toronto and Editor-in-Chief of The Energy Journal.