
StatsCan Ontario estimate
of April unemployment
likely too low
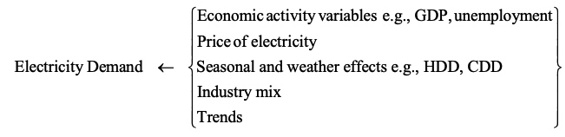
Modelling electricity demand
Models of electricity demand have been estimated for many years and in numerous jurisdictions worldwide. These models typically incorporate a range of factors, including: measures of economic activity such as GDP and unemployment; the price of electricity and prices of substitutes, such as natural gas; seasonal and weather variables, such as ‘heating degree days’ and ‘cooling degree days’ (HDD and CDD, respectively); structural variables which reflect shifts in the economy's industrial mix; and, trend variables to capture longer-term shifts in electricity intensity and other secular effects not captured by variables in the model.
These models track long-term patterns in electricity consumption and are important in the formulation of electricity system forecasting and planning.
Amidst the current COVID-19 pandemic such models can be adapted to estimate changes in economic activity from electricity demand.
Normalizing electricity demand
To obtain an approximate rule-of-thumb, which can be used to provide real-time assessments of unemployment based on electricity demand, we estimate an electricity demand model using monthly Ontario data for the period 2004 to 2019. Our basic model includes weather variables, seasonal effects, long-term trend, and Ontario unemployment.[1] The dependent variable is Ontario electricity demand, publicly available from the Independent Electricity System Operator (IESO).[2]
Normalized demand is obtained by removing weather and seasonal effects, long-term trend, and then centering around zero. Figure 1 plots normalized demand against the unemployment rate, along with a fitted regression line. There is a strong negative relationship.
In our preliminary model, the coefficient of unemployment in the estimated model implies that a one per cent increase in unemployment correlates with a 1.2 per cent decrease in normalized electricity demand.
Figure 1: The effect of unemployment on electricity demand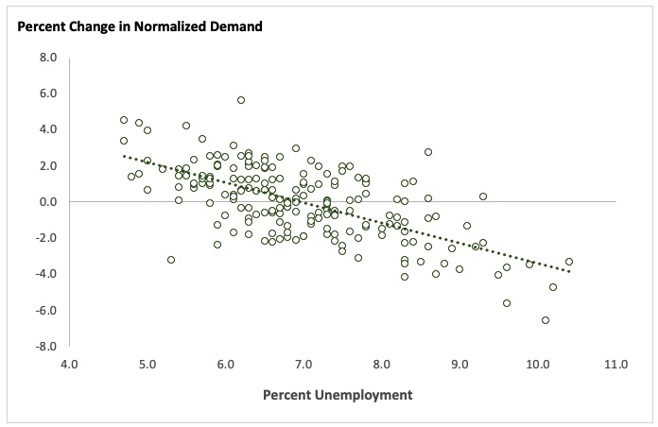
Predicting Ontario unemployment using electricity data
We assess that demand in January and February 2020 is comparable to 2019. The IESO estimates a reduction in demand of 10-12 per cent by the third week of April. Our own estimates are in the 8-10 per cent range based on a regression methodology. In the following, we will use a figure of 10 per cent.
According to Statistics Canada, unemployment in January 2020 was 5.2 per cent, rising to 11.3 per cent in April. Based on electricity demand, unemployment is actually estimated to have risen to closer to 14 per cent.
Methods for capturing labour market disruption caused by COVID-19
There are plausible explanations as to why the electricity-based unemployment estimate exceeds the one provided by Statistics Canada. For example, the unemployment rate reported by Statistics Canada uses the standard concept for unemployment, defined as those who are available to work but are without a job. As Statistic Canada reports, this indicator does not count as unemployed those who recently worked but did not look for work in April, presumably due to ongoing business closures and very limited opportunities to find new work. When Statistics Canada adds these individuals among the unemployed, its estimate of the unemployment rate is several percentage points higher.
The decline in electricity usage at commercial and industrial sites reflects the overall level of under-employment in the economy; not just lost jobs as per the standard definition but also those who have had to leave the labour force for COVID-19 related reasons. In future work, we will be incorporating other labour market data, such as hours worked and participation rates, in the analysis.
Suffice it to say for now, that based on what we are seeing in our electricity markets, labour market conditions in April were likely significantly worse than would be suggested by the 11.3 per cent unemployment rate.
[1] The “weather/seasonal variables” include CDD, HDD and monthly dummies, for simplicity, the long-term trend is linear, though we also test alternative nonlinear trends. We also tested various electricity price variables including those provided by Statistics Canada and prices derived from IESO data on the wholesale market price and the ‘global adjustment.’
[2] As indicated in our blog dated May 1, 2020, this variable needs to be viewed with care, as it does not incorporate electricity production within the boundaries of distributors.
Brian Rivard is Adjunct Professor and Research Director, Ivey Energy Policy and Management Centre at Western University. Adonis Yatchew is Professor of Economics at the University of Toronto and Editor-in-Chief of The Energy Journal.