Indicator Definition
Rating of the host nation’s general practices for the ease around arranging business meetings, access to decision makers and clarity of decision-making processes.
Coding Methodology
We measured the Hassle Factor business facilitation indicator based on six sub-indictors grouped in two categories: reliability and openness. We used Global Road Warrior (GRW) a web based travel resource with detailed descriptions of most of the world’s countries and economies. For this indicator we used the GRW description of each host nation’s business climate.
|
Category |
Sub-indicator |
|
Reliability |
Meeting Reliability |
|
Reliably implement agreements |
|
|
Speed of decision making |
|
|
Openness |
Access to the decision-maker |
|
Openness to foreign business persons |
|
|
Negotiating attitude |
Each sub-indicator was coded using a three-point Likert scale. We coded the sub-indicators using the criteria in the tables below. These scores were converted to a seven-point scale using the following formula:
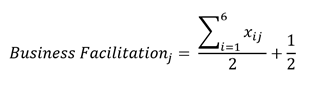
Where: i = sub-indicator scores and, j = country. The results were rounded to the nearest whole number.
Meeting Reliability
|
Criteria |
Code |
|
Meetings generally take place on time and as scheduled |
0 |
|
Meetings may be delayed, may run over at the allotted amount of time or maybe re-scheduled with some notice |
1 |
|
Meetings rarely start on time, often run over the allotted time or may be cancelled with little notice |
2 |
Reliably implement agreements
|
Criteria |
Code |
|
Agreements are generally implemented will little follow up from international partners. Contracts are enforceable under the local legal system. |
0 |
|
Some follow up and monitoring may be required. Contracts are generally enforceable under the legal system, but local businesses may prefer verbal agreements. |
1 |
|
Follow up and monitoring is likely required. Contracts are generally not enforceable under the legal system or local businesses prefer verbal agreements. |
2 |
Speed of decision-making
|
Criteria |
Code |
|
Decisions are made in a timely manner and swiftly moved towards action |
0 |
|
Decisions take some time due to internal consultations, risk analysis or are delayed because of local culture’s trust-building processes between potential partners. |
1 |
|
Decision making is a protracted possess that involves extensive internal consultations, risks analysis or a lengthy trust-building process between potential partners. |
2 |
Access to the decision-maker
|
Criteria |
Code |
|
Key decision-makers are easily accessible, sometimes on the first visit |
0 |
|
Gate-keepers manage access to key decision-makers, but meetings will eventually take place. Potential foreign partners may meet with the decision-makers initially, but future meetings are likely to be with delegated managers. |
1 |
|
Many meetings are required at multiple levels within the organization before being granted access to decision-makers. In some cases, the foreign partner may never meet the decision-makers. |
2 |
Openness to foreign businesspersons
|
Criteria |
Code |
|
Foreign business is welcome and foreign businesspeople can easily access the business community |
0 |
|
Foreign business is welcome but foreign business people may not be initially trusted. Contacts in the local business networks are helpful in gaining access to the business community. |
1 |
|
Foreign business is difficult because foreign business people are often mistrusted and local contacts are essential to gaining assess to the business community. |
2 |
Negotiating attitude
|
Criteria |
Code |
|
Negotiations are approached from a co-operative point of view with mutual benefit as the desired outcome. |
0 |
|
Negotiations are approached from a neutral point of view with balancing risks and rewards as the desired outcome. |
1 |
|
Negotiations are approached from a competitive point of view with the winner taking all as the desired outcome. |
2 |
Data Imputation
Insufficient data was available for 14 countries. In these cases, we estimated the missing data using the averages scores for a group of similar economies. To determine the average scores we grouped all 180 countries in four groups using World Bank’s Economic Classifications. We then removed the 14 countries with missing data and calculated the average for each of the four groups. The 14 countries were added back to their respective groups and were assigned that group’s average score. This process was completed for each year we measured. The following tables outline the estimated data points.
| Economic Classification (EC) | Abbreviation | Averages Scores | ||||
| 2008 | 2010 | 2012 | 2014 | 2016 | ||
| High Income | HI | 2 | 2 | 2 | 2 | 2 |
| Upper Middle Income | UMI | 4 | 4 | 4 | 4 | 4 |
| Lower Middle Income | LMI | 4 | 4 | 4 | 4 | 4 |
| Low Income | LI | 5 | 5 | 5 | 5 | 5 |
| Table of Estimated Indicator Scores by Country and Year | ||||||||||
| 2008 | 2010 | 2012 | 2014 | 2016 | ||||||
| EC | Estimated Value |
EC | Estimated Value |
EC | Estimated Value |
EC | Estimated Value |
EC | Estimated Value |
|
| Barbados | HI | 2 | HI | 2 | HI | 2 | HI | 2 | HI | 2 |
| New Caledonia | HI | 2 | HI | 2 | HI | 2 | HI | 2 | HI | 2 |
| Puerto Rico | HI | 2 | HI | 2 | HI | 2 | HI | 2 | HI | 2 |
| Dem. Rep. Congo | LI | 5 | LI | 5 | LI | 5 | LI | 5 | LI | 5 |
| Bhutan | LMI | 4 | LMI | 4 | LMI | 4 | LMI | 4 | LMI | 4 |
| Cape Verde | LMI | 4 | LMI | 4 | LMI | 4 | LMI | 4 | LMI | 4 |
| Congo, Rep. | LMI | 4 | LMI | 4 | LMI | 4 | LMI | 4 | LMI | 4 |
| Palestine | LMI | 4 | LMI | 4 | LMI | 4 | LMI | 4 | LMI | 4 |
| Samoa | LMI | 4 | LMI | 4 | LMI | 4 | LMI | 4 | UM | 4 |
| Timor-Leste | LMI | 4 | LMI | 4 | LMI | 4 | LMI | 4 | LMI | 4 |
| Tonga | LMI | 4 | LMI | 4 | UMI | 4 | UMI | 4 | UMI | 0 |
| Vanuatu | LMI | 4 | LMI | 4 | LMI | 4 | LMI | 4 | LMI | 4 |
| Montenegro | UMI | 4 | UMI | 4 | UMI | 4 | UMI | 4 | UMI | 4 |
| Palau Islands | UMI | 4 | UMI | 4 | UMI | 4 | UMI | 4 | HI | 2 |
Sources
World Bank, Classifying Countries by Income