Indicator Definition
Rating of climate comfort/pleasantness in each country’s business capital.
Coding Methodology
The Hassle Factor climate indicator consists of four sub-indicators: temperature, precipitation, humidity and major weather events.
Temperature
We measured the temperature sub-indicator on two dimensions including temperature extremes and seasonal variation. When available, weather data was collected for each of the country’s business capitals. If data was unavailable, we used data from the nearest weather station. Generally, this data came from weather stations at the cities’ major airports as these records were often the most complete. We used data from WeatherSpark.com, a web-based resource that displays weather data for over 150,000 locations worldwide.
To measure extremes, we recorded the highest and lowest temperatures for the warmest and coldest months respectively for each year. To control for outlying data points, we selected the highest and lowest temperatures that were within 1 degree of the normal range for that month. To measure seasonal variation, we subtracted each country’s low temperature from the high temperature.
We experimented with several coding schemes each using different criteria as a baseline. For example, we looked at using the temperatures and variations for Tokyo Japan as the baseline. We also looked at anchoring the baselines in the annual data sets by fixing the baselines to a standard deviation. However, temperatures are rarely identical from one year to the next. In many countries, they vary considerably. This was true even when we controlled for outliers by using data from within the normal temperature range. Because of this annual variation, our baselines were quite different from one year to the next. This resulted in a higher level of volatility between annual data sets than we considered acceptable from a conceptual point of view. To counter this volatility, we applied the same baselines to each year we measured.
We coded the temperature sub-indicators using the following scheme:
|
Sub-indicator |
Baselines in degrees Celsius |
Code |
|
Temperature - High |
Between 15 C and 35 C |
0 |
|
Temperature - High |
Greater than 35 C |
1 |
|
Temperature - High |
Lower than 15 C |
1 |
|
Temperature - Low |
Lower than -5 C |
1 |
|
Temperature - Seasonal variation |
A difference less than 40 C |
0 |
|
Temperature - Seasonal variation |
A difference greater than 40 C |
1 |
Precipitation
As with the temperature, we measured the precipitation sub-indicator on two dimensions: the overall annual precipitation rate in millimetres and seasonal variation. To measure overall precipitation, we collected the average annual precipitation for the business capital of each country. To measure seasonal variation, we calculated the percentage of annual precipitation that occurs over the six consecutive months that have the highest precipitation rates. We used data from weatherbase.com, a web-based resource with weather data on over 41,000 cities worldwide.
The following tables outline the coding scheme used for the precipitation sub-indicator.
|
Sub-indicator |
Baselines in mm and percentages |
Code |
|
Precipitation – Annual Total |
Between 400 and 1200 mm |
0 |
|
Precipitation – Annual Total |
Less than 400 mm |
1 |
|
Precipitation – Annual Total |
Greater than 1200 mm |
1 |
|
Precipitation - Seasonal variation |
A difference greater than 65% in six months |
1 |
|
Precipitation - Seasonal variation |
A difference greater than 85% in six months |
2 |
Humidity
The humidity sub-indicator measures the level of discomfort felt in a particular environment using dew point temperatures. We coded humidity using an existing scale from WeatherSpark.com. The scale uses six categorizations: dry, comfortable, humid, muggy, oppressive and miserable. The temperatures range from 13 C on the low end to 24 C on the high end. WeatherSpark displays the data on an interactive chart and is available on a multi-year average, annual, monthly, daily and hourly bases. To code this sub-indicator, we visually inspected the annual charts for each year in the data set. We then selected to code that corresponded best with the approximate annual average dew point for that year.
The following table outlines the coding scheme used for the humidity sub-indicator.
|
Sub-indicator |
Category |
Basslines in dew point temperatures in degrees Celsius |
Code |
|
Humidity |
Dry |
Less than 13 C |
0 |
|
Humidity |
Comfortable |
Between 13 C and 16 C |
1 |
|
Humidity |
Humid |
Between 16 C and 18 C |
2 |
|
Humidity |
Muggy |
Between 18 C and 21 C |
3 |
|
Humidity |
Oppressive |
Between 21 C and 24 C |
4 |
|
Humidity |
Miserable |
Greater than 24 C |
5 |
Major Weather Events
The major weather event sub-indicator is a measurement of the impact of climate-related events on the human and economic wellbeing of the respective country. To code this sub-indicator, we used data from the Global Climate Risk Index (GCRI). Specifically, we looked at the list of the 10 countries most affected by major climatic events. This list is a standard part of the GCRI annual reports and is calculated using four criteria: Total number of deaths, number of deaths relative to the countries’ population, the total cost of damages, and the cost of damages as a percentage of the country’s GDP. We included the 10 countries listed in the GCRI for each year we looked at. Each country listed was coded an additional one point for that year.
|
Sub-indicator |
Baselines yes or no |
Code |
|
Major Weather Event – No |
No |
0 |
|
Major Weather Event – Yes |
Yes |
1 |
The highest possible score for the major weather event sub-indicator is one.
Indicator Conversation Formula
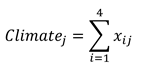
Where: i = sub-indicator scores and, j = country. Scores of less than one were rounded to one and scores greater than seven were rounded to seven.
Data Imputation
In five cases, temperature and humidity data was not available in the country’s business capital. In these five cases, we substituted data from the nearest weather station. In 11 cases, temperature and humidity data was not complete enough to collect measurements on an annual basis and the nearest alternate weather station was more than 200 km away. In these cases, we used the average high and average low for the hottest and coldest months respectively for all years on record. Similarly, we used the average humidity rating for all years on record. In five cases, precipitation data was not available for the location selected. In these cases, we used data from the nearest weather station.
In total, we substituted approximately 83 of the 1980 data points collected for each year. This represents just over four percent of the total data set.
Sources